Summary #
Domestic greywater recycling systems in households collect mildly contaminated greywater from showers and laundry machines and give it a treatment that allows for reusing it safely for non-potable purposes. A life cycle assessment of the greywater recycling system “Hydraloop” was done to determine the environmental impacts caused by the implementation and operation of such a system. The environmental impacts of recycling water are compared to those of the conventional linear water cycle to make design and implementation decisions. This study was done to provide information on the environmental impact of the product Hydraloop H300 to clients, partners, and the general public.
Introduction #
Water scarcity is currently an alarming issue in several areas of the world. Urban and suburban areas have an increasing demand for water as a consequence of population growth and industrial activity with climate change making the issue more serious [1–3]. Moreover, freshwater consumption and its potabilization have a significant environmental impact [4]. Minimizing the need for freshwater and the energy use associated with its production and consumption is fundamental for water security and environmental protection. Reusing water is a paradigm shift that could make it possible to supply water avoiding unnecessary transport to the location where it is needed [5]. Solutions for a more efficient use of water have become increasingly important in recent years, water reuse for instance is one of the easiest solutions to implement [6]. Decentralized water reuse systems are a promising approach for a more efficient use of water, these systems allow treating the used water where it is created, saving on costly transport, distribution, and associated losses [6].
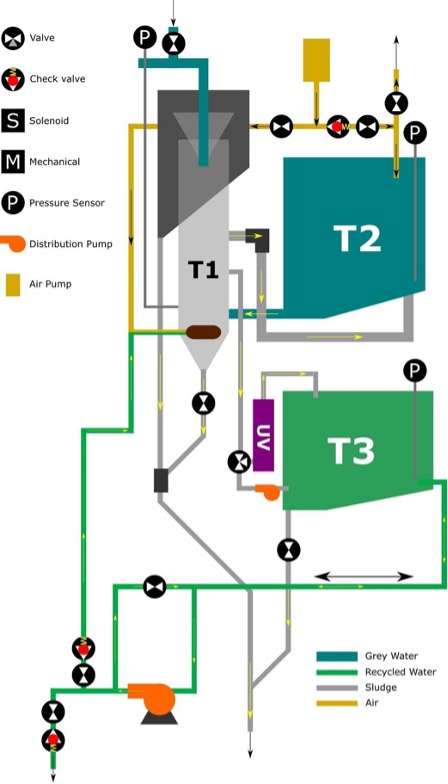
Water has already been reused for decades in water-scarce regions, recently it is also starting to be a practice outside dry areas where legislation and public perception are a challenge [7]. In the conventional configuration of a household, wastewater is a mix of several streams, greywater; feces; and urine [8]. Greywater from showering and laundry, excluding kitchen water, is a mix of relatively good quality water that after treatment can safely be reused for non-potable purposes [9]. In this study, we consider greywater as solely the water fraction originating from showers, handwashing, and the rinsing cycle of laundry machines. The pollutants treated in these streams are mostly solids, organic substances, detergents, and micro(plastic) fibers. Greywater enters the greywater recycling system at the top of T1 (Figure 1), the solids are removed by sedimentation and flotation, while detergents and micro(plastic) fibers are removed to a large extent by foam fractionation powered by aeration [10–12]. A remaining fraction of detergent and organic substances are removed by an aerobic biological process [13] occurring in T2 (Figure 1). The excess sludge of the biological process and the sedimented and floated-out solids are diverted to the sewer frequently, via either the foam diverter at the top of T1 or the solid accumulation funnel at the bottom of T1 (Figure 1). UV-C disinfection is used as the final treatment to achieve the microbiological safety needed for recycling water and make it useful for non-potable purposes again. Hydraloop Systems BV produces commercially available compact greywater recycling systems that rely on 6 processes foam fractionation, air flotation, flotation, sedimentation, moving biofilm bed reactor, and UV-C disinfection; the unit is fully automated and requires minimum maintenance [14].
It is common to use potable water to supply all the water needs in households. However, not all uses of water require the same water quality [9]. Potable water requires a more strict treatment and control of quality [9], while non-potable water can still be safely used after simpler and less intensive technologies for purposes other than human consumption. For example, toilet flushing, cleaning of flooring, irrigation of gardens and ornamental plants crops, as well as topping up swimming pools with traditional disinfection and treatment systems [9,14].
The environmental impact of the use as well as the reuse of freshwater is strongly linked to the type of electricity used for the treatment processes required and its environmental impact, which varies widely with location and technology [6,15–17]. The environmental impact of producing drinking water is often overlooked, it stems from the infrastructure, energy requirements, use of chemicals, treatment of waste generated, transport, and baseline water stress at the location. The reuse of greywater also results in a decrease in the volume of wastewater generated in a household, while the pollution load of the wastewater is likely to have only a minor decrease that can often be neglected [18]. This volume decrease can result in lower environmental impacts in operations related to pumping or strongly affected by volume.
The goal of this study is to determine the environmental impact of decentralized domestic greywater reuse by means of Hydraloop and to establish a framework for decision-making on whether implementing a greywater recycling system would have a lesser environmental impact compared to the conventional linear water system in a household.
Method #
Life cycle assessment (LCA) is a commonly used method to determine the environmental impact of products, systems, services, and processes such as potable water production. This type of study must be done on a defined regional scale [19] and in line with the ISO 14040/44 standards [20]. Eco-costs is a prevention-based metric that can be used within the LCA methodology. The methodology of the Eco-costs allows the calculation of the external costs of preventing the environmental impact of a product or service and provides a global metric that includes the costs of preventing the environmental impact of climate change, resource scarcity, eco-toxicity, and human health [20,21]. The values of the indicators were obtained from the LCI database Idemat 2023 and modified based on recent literature depending on the location. The LCA of greywater recycling was done following the four methodological steps (1) goal and scope definition, (2) life cycle inventory analysis, (3) life cycle impact assessment, and (4) life cycle interpretation [22].
Goals and scope definition #
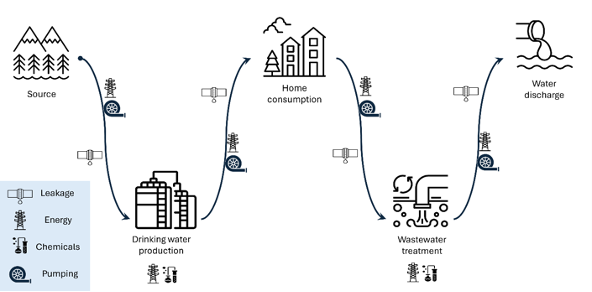
The environmental impact of greywater recycling in a household was assessed by comparing three different scenarios in which scenario 1 refers to the conventional linear tap water system and scenarios 2 and 3 refer to greywater reuse with two different energy sources; local grid mix and solar power respectively (Figure 2). The greywater treatment unit has the function of collecting and treating the collected greywater improving its quality to a level of compliance with the standard NSF/ANSI 350 [23]. The scenarios are assessed under regional conditions in the following geographical regions: Central Europe, MENA region, and North America. The functional unit chosen for this study is 1 m3 of water, allowing a comparison of the eco-costs of 1 m3 of the conventional linear water cycle with the recycling of 1 m3 of greywater. The system boundaries start at the capture of raw water for tap water production and end at the treated water discharge of the wastewater treatment plant (Figure 2).
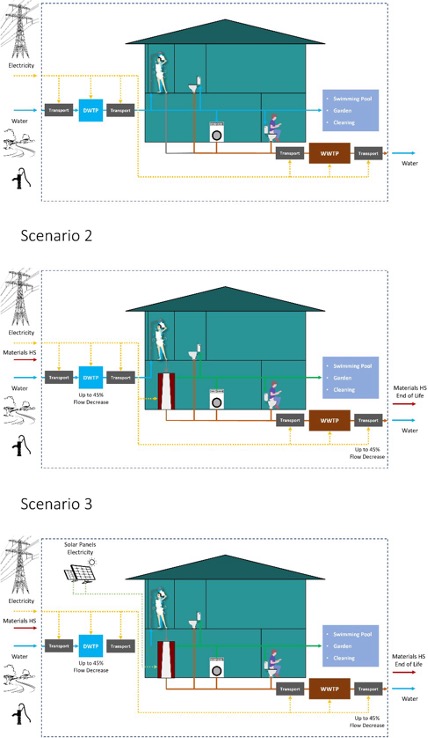
The scope of the analyses of Scenario 1 includes all operations performed on water from the abstraction from the source to the discharge back to the environment after treatment in a wastewater treatment plant. Scenarios 2 and 3 also include the energy consumption of the greywater recycling system, the environmental cost of the materials, the most significant processes used for the production, the end of life of the water recycling system, and the wastewater generated. The environmental cost of the transportation of the Hydraloop system; components replacement and maintenance; energy used during production assembly; and the network from and to Hydraloop are excluded in this analysis and are not expected to represent more than a 5% increase in the metric value calculation. The materials used in the water networks from and to Hydraloop, which are the household’s greywater collection, and recycled water distribution networks respectively; can be excluded from the comparative analysis of the three scenarios since these networks are expected to have a similar material demand in the three scenarios (Figure 2). This exclusion is also called streamlining, a way to simplify life cycle assessment systems by not including elements in the comparison when these are considered the same in the scenarios to be compared [24].
Life Cycle Inventory Analysis #
Baseline #
The baseline for the determination of the environmental impact of recycling greywater was calculated by adding the environmental impact of the different operations that make up part of the conventional domestic water chain (Equation 1, Annex). The elements included to calculate the eco-costs of the conventional linear water cycle include:
- The ecocosts of drinking water production (Equation 2, Annex): including the operations of harvest (abstraction) of water from the source, pretreatment, transport from source to drinking water treatment plant (DWTP), treatment at DWTP, transport and distribution to users, losses in transport and distribution (Figure 3)
- The ecocosts of wastewater treatment and discharge (Equation 3, Annex): including the operations of collection, transport to a wastewater treatment plant, treatment at wastewater treatment plant, and transport to discharge (Figure 3).
The eco-costs of the conventional linear water cycle are determined using the basis values provided for tap water in the database Idemat2023 created by Sustainability Impact Metrics, a spin-off of the Delft University of Technology [25]. These values are modified based on the carbon intensity and the baseline water stress at each of the locations based on data from the literature (Table 1). The Idemat database was generated in compliance with the ISO 14040, 14044, EN15804, and the LCA handbook of the ILCD [26].
| Location | Component | Reference |
|---|---|---|
| New York | Transport (Source to DWTP) Treatment at DWTP Distribution (DWTP to User) Loses (Leakage) WWTP | [6] [27] [6] [28] [29] |
| California | Transport (Source to DWTP) Treatment at DWTP Distribution (DWTP to User) Loses (Leakage) WWTP | [30] [6] [30] [6] [29] |
| Belgium | Transport (Source to DWTP) Treatment at DWTP Distribution (DWTP to User) Loses (Leakage) WWTP | – [31] – [6] [29] |
| Netherlands | Pretreatment (Softening) Transport (Source to DWTP) Treatment at DWTP Distribution (DWTP to User) Loses (Leakage) WWTP | [32] [6] [32] [33] [34] [33] |
| Morocco | Transport (Source to DWTP) Treatment at DWTP Distribution (DWTP to User) Loses (Leakage) WWTP | [6] [35] [6] [36] [35] |
| KSA | Transport (Source to DWTP) Treatment at DWTP Distribution (DWTP to User) Loses (Leakage) WWTP | [6] [37] [6] [38] [37] |
Recycling greywater decreases the volume of wastewater generated in households. This decrease in wastewater volume can be translated into energy savings in the wastewater treatment plant in operations connected to the pumping of water. In the case of a 50% decrease in wastewater volume, a 30% decrease in electricity can be expected, a larger volume decrease must be analyzed carefully by modeling to determine the impact on the energy consumption of a plant [18]. Hydraloop Systems divert most of the COD and solids load toward the sewage after these are removed from the greywater but with up to a 45% decrease in volume. For the estimation of the impact of this volume reduction, we used the eco-costs of wastewater at the different locations and decreased it by 30% to account for the effects of decreased volumes (Equations 3 and 4).
The water imported from the tap water network into the household is assumed as water withdrawal and its eco-costs were calculated based on the Idemat2023 database and adjusted using values representative for each location studied as found in other studies (Table 1). The eco-costs of withdrawing water from the source and entering the system, are not canceled by water exiting the system after being discharged back to the environment. This is because the effluent of a conventional wastewater treatment plant has significantly worse quality than the withdrawn water and it is generally discharged at a different location downstream (Figure 2) [6].
The eco-costs values of the withdrawn water are also adjusted according to the baseline water stress at each location extracted from the Aqueduct Water Risk Atlas [39] (Table 2). The eco-costs of 1 m3 of water through the conventional linear water cycle could be later compared to those of reusing 1 m3 of treated greywater using the greywater recycling system.
| Location/Region | Baseline Water Stress |
|---|---|
| New York, NY, USA | 0.097 |
| California, USA | 1.251 |
| Belgium | 0.639 |
| Netherlands | 0.080 |
| Morocco | 1.333 |
| Saudi Arabia | 0.698 |
Construction Assessment of Greywater Recycling System #
The lifetime environmental impact of the materials and main processes used in the construction of the Hydraloop System given in eco-costs-euros was determined by inventorying 95% of the mass of single materials used in the construction of the system (Table 3). The values of eco-costs for the different materials were obtained in the database Idemat2023. The inventory also included HDPE rotational molding (using the eco-costs of thermoforming), rolling steel, and the waste disposal of the unit by landfilling based on the Idemat2023 database. The system’s lifetime is defined as 20 years. The eco-costs of the construction and end of life of the Hydraloop System are included in the production phase eco- costs (Equation 5, Annex)
| Material/Process | Weight (Kg) |
|---|---|
| HDPE | 56.1 |
| PC | 0.37 |
| Stainless Steel 304 | 7.43 |
| Aluminium Alloy | 2.16 |
| PCB | 0.27 |
| PVC | 0.71 |
| PP | 0.37 |
| Galvanized Steel | 1.10 |
| EPMD | 0.49 |
| POM | 0.65 |
| Brass | 3.09 |
| PU | 0.47 |
| PA | 0.01 |
| Steel 55Si7 | 0.49 |
| Copper | 0.19 |
| Cast Iron | 0.37 |
| Magnet | 0.09 |
| Batteries Ass. AA | 0.04 |
| Rolling Steel | Based on Stainless Steel Sheets (7.1 kg) |
| Rolling Aluminium | Based on Aluminium Sheets (2.2 kg) |
| HDPE Rotation Moulding | Based on Rotation Moulding Parts (44.5 kg) |
| Waste Disposal End of Life | Based on Total Weight (78.2 kg) |
| Total Accounted Materials | 74.39 |
| Total Weight (Kg) | 78.2 |
| Percentage Included | 95% |
Operation Assessment of the Greywater Recycling System #
The Hydraloop System is estimated to consume 180 kWh/y based on the average operation of Hydraloop systems installed in pilot locations. This electricity can be sourced from the local electricity network or from household solar panel generation, therefore the three different scenarios mentioned previously. The eco-cost values for the local energy mix for each country were sourced in the Idemat2023 database [25]. Similarly, solar energy was assumed as generated by PV panels with the specifications given by [40]. The panel’s output of 1100 kWh/m2 [40] was adjusted proportionally to the difference in sun irradiance at the different locations obtained from [41], and assuming a linear correlation between irradiance and solar
panel output. The eco-costs of the use phase of the Hydraloop system are then calculated using Equation 6 (Annex).
The system is fully automated and relies on a stable internet connection for the finetuning of the operation, software updates, and self-diagnosis of the status of critical components. The environmental impact of the telecommunications and data processing required by the unit are not considered in this study and are considered marginal.
Water recycling estimations #
The water recycling system considered for this study (Hydraloop H300, Hydraloop Systems BV, the Netherlands) has a greywater treatment capacity of 530 L∙d-1. In the current European practice, the use case of this system is estimated to recycle an average of 159 L∙d-1 (58.000 L∙y-1). This value was calculated assuming one shower per person per day with a duration of 7.4 min [42], a shower water flow or 10 L/min [43], and a household size of 3 people [44]. In this context, of the 119 L∙p-1∙d-1 [45] consumed in the Netherlands, 45% of the water could be recycled by the Hydraloop, this accounts for the recycling of two- thirds (67%) of the shower water generated in a household. In the Middle East and East Africa (MENA) region, the expected use case of an H300 is 202% of the European use case based on a reported water consumption of 241 L∙p-1∙d-1 [46], hence 321 L∙d-1 (117.115 L∙y-1). In the US, the expected use case of an H300 is 125% of the European use case based on a reported water consumption of 302 L∙p-1∙d-1 [47], hence 402 L∙d-1 (146.799 L∙y-1).
Life Cycle Impact Assessment #
The environmental consequences of the implementation of a greywater recycling system in a household are assessed by comparing the eco-costs of production of 1 m3 of tap water used in scenario 1 with the process of recycling 1 m3 of greywater in scenarios 2 and 3 (Figure 2). The scenarios are analyzed in the context of six locations within three geographical regions: the Netherlands and Belgium in Central Europe, Morocco and KSA in the MENA region, and the states of New York and California in the US, and North America.
The data for the calculation of the eco-costs of the conventional water cycle is sourced from relevant literature, either peer-reviewed papers or reports from official authorities or drinking water companies (Table 1). The standard values for water use as in the conventional water cycle were adjusted to the specific locations based on either LCA studies providing data specific to the area or official reports from drinking water companies, government, or institutions dealing with water availability and governance, as
well as the Idemat2023 electricity eco-costs. The calculations for the adjustment of the values are explained in Annex.
Results and Discussion #
Construction Eco-costs of Greywater Recycling System #
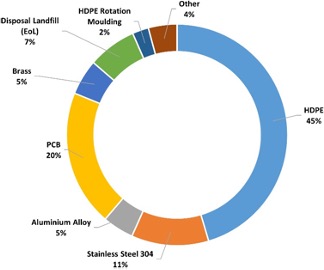
The eco-costs of the Hydraloop construction added to 143 eco-cost-euros. The largest contribution to the eco-costs was given by the high-density polyethylene (HDPE) which accounted for 46% of the eco-costs of the system (Figure 4). HDPE is the material with the largest contribution to the weight of the system, being used for the tanks and structural support. The second largest contribution is the printed circuit board (PCB) included in the construction which accounted for 20% of the eco-costs followed by the Stainless Steel mainly used in the front plate accounting for 11% of the eco-costs of the unit. Based on the functionality of these materials, the largest potential part for eco-design is the Stainless Steel front plate, because, for the HDPE parts and PCBs, it is difficult to find substitutes with the same functionality and aesthetics. Also, it could be worthwhile to look into reusing (parts of) Hydraloop at the end of life to lower the eco-costs at the end of life.
Eco-costs of recycled greywater in comparison with water from the conventional water chain #
The eco-costs of using 1 m3 of water through the conventional water chain (Scenario 1) are compared with the eco-costs of recycling 1 m3 of greywater assuming the water recycling system uses two different
sources of electricity; the local network providing the local energy mix (Scenario 2) and solar panels installed at the location of the greywater recycling system (Scenario 3) (Figure 2).
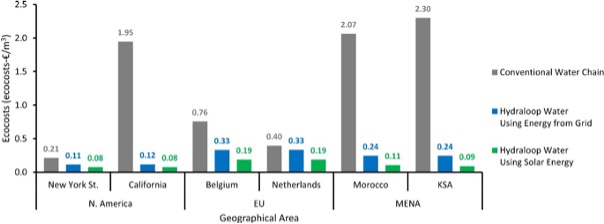
The eco-costs of recycling 1 m3 of greywater were lower than the eco-costs of using 1 m3 of water via the conventional water chain in all of the studied locations (Figure 5). The use of water via the conventional water chain of production had a large range of variation in eco-costs with values between 0.21 and 2.30 €∙m-3 depending on the location, while the eco-costs of recycling of 1 m3 of grey water had a much smaller range of variation with values between 0.11 and 0.33 €/m3 depending on the local energy mix. The range of variation of eco-costs of recycled water is even smaller when using electricity generated by solar panels giving values between 0.08 and 0.19 €/m3. The locations with the highest eco-costs for the conventional water chain are California, Morocco, and KSE giving values of 1.95, 2.07, and 2.30 €/m3 respectively. These three locations share the highest levels of baseline water stress (BWS) among the studied locations (Table 2). The state of New York US, Belgium, and the Netherlands presented much lower eco-costs of the conventional water chain also corresponding to a lower level of baseline water stress giving eco-costs values of 0.21, 0.76, and 0.40 €/m3 respectively.
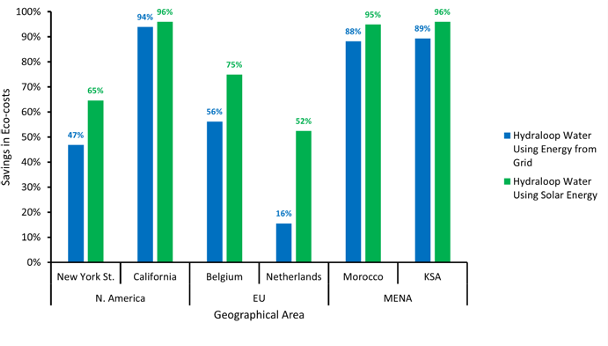
The difference in eco-costs between using 1 m3 of water through the conventional water chain and recycling 1 m3 of greywater using energy from the grid is reflected in eco-costs savings between 16% and 94%, the location with the lowest eco-costs savings was the Netherlands where recycling greywater would save only 16% in eco-costs (Figure 6). This is due to the lower amount of water that could be recovered in Europe (of 119 L∙p-1∙d-1 [45]) in comparison to the other regions combined with a lower baseline water stress. The use of solar panels to power the greywater recycling system increases the potential eco-costs savings significantly, for example in the Netherlands, the eco-costs savings increased from 16% to 52% compared to the local energy grid situation. In the locations with high BWS; California, Morocco and KSA the ecocosts savings when using solar energy ranged between 95% and 96% (Figure 6).
Lower eco-costs values indicate a lower environmental burden. These results show that the implementation of a greywater recycling system can generate eco-costs savings and contribute to a more environmentally friendly use of water.
Production Phase vs Use Phase Eco-costs of the Greywater Recycling System #
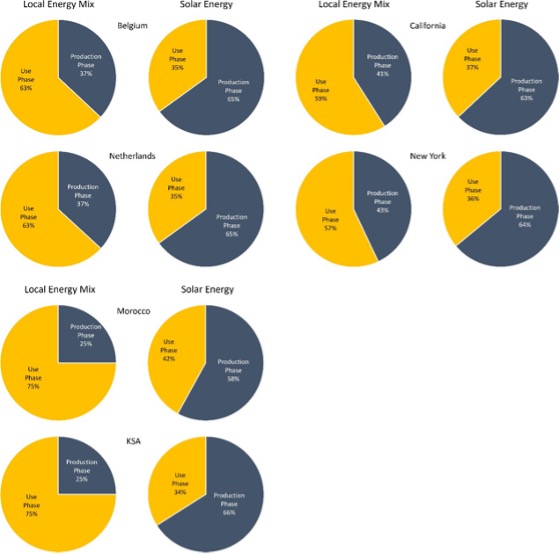
The separate contributions to the eco-costs of the greywater recycling system differ by location (Figure 7). When using the local energy mix of the different locations, the largest contribution to eco-costs stems from the electricity consumption which is the only significant aspect of the system operation or use phase.
The contribution of the use phase (electricity consumption) to the eco-costs of recycling 1 m3 of greywater varies between 59% and 75% when the system uses electricity from the local energy mix and decreases values between 34% and 42% when using solar panels to power the unit (Figure 6). These differences are due to the large impact that the carbon intensity of the electricity used to power the greywater recycling system has on the eco-costs of the system.
Since Hydraloop Systems is using the local electricity mix, the best strategy is to decrease the eco-costs of recycling 1 m3 of greywater to decrease the energy consumption of the use phase, for example by using solar energy to power the greywater recycling system., Another reduction strategy would be to focus on decreasing the mass of materials such as HDPE or Stainless Steel (Table 2) or on replacing such materials with others with lower associated eco-costs.
Sensitivity Analysis #
Greywater Recycling System Electricity Consumption #
The greywater recycling system operation eco-costs per volume are defined by the electricity consumption of the system. When considering the scenario when the Hydraloop operates with the local electricity mix, all the locations show a larger contribution of the use phase to the eco-costs (57%-75%) with respect to the contribution of the production phase (25%-43%) (Figure 7). Therefore, we analyze the eco-costs of the greywater recycling system under different electricity consumptions in the use case of the Netherlands (Figure 8). In the case the energy consumption of the Hydraloop using the Dutch local electricity mix increases above 237 kWh/y, the eco-costs of the recycled water will be higher than those of using water through the conventional water chain. This value limit changes depending on the use case and it is strongly link to the specific eco-costs of the electricity mix at the location studied.
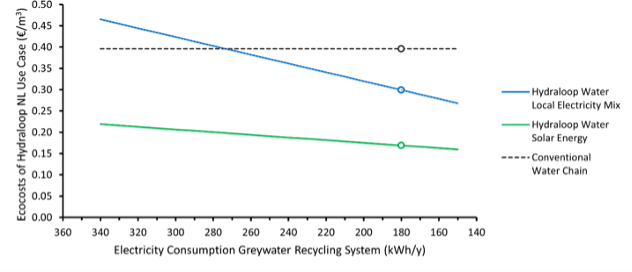
At an energy consumption below 237 kWh/y recycling 1 m3 of greywater via Hydraloop Systems is generating eco-costs savings (Figure 8). The reference consumption determined in a normally operating system was 180 kWh/y, significantly lower than the limit to generate eco-costs savings in the case of the Netherlands.
Water Savings #
Assuming the electricity consumption of the normally operating greywater recycling system of 180 kWh/y, we also analyzed the effect of changing water savings on the eco-costs of recycled water for the use case of the Netherlands (Figure 9). The recycled water eco-costs increases exponentially at decreasing volumes of greywater recycling. Recycling greywater by Hydraloop would generate eco-costs savings when the water savings of the unit are above 50 m3/y. In the use case of Europe, the water savings estimations are 58 m3/y well above this threshold (Figure 9).
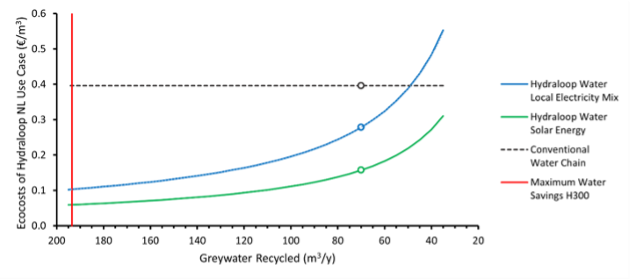
The increase in water savings decrease asymptotically as it gets closer to the maximum capacity of the system of 193 m3/y exhibiting a large increase in eco-costs saving potential as the unit treatment capacity is more
Conclusions #
In overall, recycling greywater contributes to a more efficient and environmentally friendly use of domestic water. Replacing 1 m3 of drinking water by 1 m3 of treated greywater for non-potable uses generates savings on eco-costs of household’s water use between 16% and 94% when using electricity from the local energy mix. This value changes for each location depending on the eco-costs of the local electricity mix resulting in marginal savings in some locations. The savings in eco-costs at certain locations can be up to 96% when using electricity generated by solar panels. Eco-costs savings are highly dependent on the volumes of water recycled per unit per year, in the case of the Netherlands, the eco-costs savings threshold is 50 m3/y, meaning a Hydraloop System generates Eco-costs savings when recycling more than 50 m3/y. This value varies depending on the treatment related variables of an specific location.
The conditions of the different locations had a large impact in the results when the Hydraloop System was using electricity from local energy mix. In such cases, it is important to analyze the impact of the system in a given case before decision making. In the case of Hydraloop Systems using solar energy, the location dependent variability was lower and showed large potential eco-costs savings in a wide range of conditions i.e. different energy consumption of the system and different water recoveries.
This study excludes the environmental impacts of the system’s assembly, transportation, maintenance, and the consequences of additional water infrastructure required in the household such as separate networks and lift pumps, future research should focus on including this aspects of the Hydraloop System . The environmental impact of telecommunication, data storage and computing required to maintain the operation of the systems is assumed as marginal and is not included in the analysis.
Further research to improve the sustainability of Hydraloop Systems should focus on including alternative end of life treatments such as a material reuse program at the end of life for components that still have significant lifetime left. Another important issue to address in future research is the possibility of redesigning Hydraloop Systems with alternative materials with lower eco-costs or decreased mass.
References #
- B.I. Cook, J.S. Mankin, A.P. Williams, K.D. Marvel, J.E. Smerdon, H. Liu, Uncertainties, Limits, and Benefits of Climate Change Mitigation for Soil Moisture Drought in Southwestern North America, Earth’s Futur. 9 (2021) 1–19. https://doi.org/10.1029/2021EF002014.
- S.M. Vicente-Serrano, D. Peña-Angulo, S. Beguería, F. Domínguez-Castro, M. Tomás-Burguera, I. Noguera, L. Gimeno-Sotelo, A. El Kenawy, Global drought trends and future projections, Philos. Trans. R. Soc. A Math. Phys. Eng. Sci. 380 (2022). https://doi.org/10.1098/rsta.2021.0285.
- C.J. Vörösmarty, P. Green, J. Salisbury, R.B. Lammers, Global water resources: Vulnerability from climate change and population growth, Science (80-. ). 289 (2000) 284–288. https://doi.org/10.1126/science.289.5477.284.
- S. Pfister, A. Koehler, S. Hellweg, Assessing the environmental impacts of freshwater consumption in LCA, Environ. Sci. Technol. 43 (2009) 4098–4104. https://doi.org/10.1021/es802423e.
- WHO, Guidance for Producing Safe Drinking-Water, 2017. https://www.who.int/water_sanitation_health/publications/potable-reuse-guidelines/en/.
- E.W. Tow, A.L. Hartman, A. Jaworowski, I. Zucker, S. Kum, M. AzadiAghdam, E.R. Blatchley, A. Achilli, H. Gu, G.M. Urper, D.M. Warsinger, Modeling the energy consumption of potable water reuse schemes, Water Res. X. 13 (2021) 100126. https://doi.org/10.1016/j.wroa.2021.100126.
- D.M. Warsinger, S. Chakraborty, E.W. Tow, M.H. Plumlee, C. Bellona, S. Loutatidou, L. Karimi,
- A.M. Mikelonis, A. Achilli, A. Ghassemi, L.P. Padhye, S.A. Snyder, S. Curcio, C.D. Vecitis, H.A. Arafat, J.H. Lienhard, A review of polymeric membranes and processes for potable water reuse, Prog. Polym. Sci. 81 (2018) 209–237. https://doi.org/10.1016/j.progpolymsci.2018.01.004.
- K. Kujawa-Roeleveld, G. Zeeman, Anaerobic treatment in decentralised and source-separation- based sanitation concepts, Rev. Environ. Sci. Biotechnol. 5 (2006) 115–139. https://doi.org/10.1007/s11157-005-5789-9.
- K. Rabaey, T. Vandekerckhove, A. Van de Walle, D.L. Sedlak, The third route: Using extreme decentralization to create resilient urban water systems, Water Res. 185 (2020) 116276. https://doi.org/10.1016/j.watres.2020.116276.
- O. Kökkılıç, S. Mohammadi-Jam, P. Chu, C. Marion, Y. Yang, K.E. Waters, Separation of plastic wastes using froth flotation – An overview, Adv. Colloid Interface Sci. 308 (2022). https://doi.org/10.1016/j.cis.2022.102769.
- M. Priyanka, M.P. Saravanakumar, A sustainable approach for removal of microplastics from water matrix using Colloidal Gas Aphrons: New insights on flotation potential and interfacial mechanism, J. Clean. Prod. 334 (2022) 130198. https://doi.org/10.1016/j.jclepro.2021.130198.
- S. Boonyasuwat, S. Chavadej, P. Malakul, J.F. Scamehorn, Anionic and cationic surfactant recovery from water using a multistage foam fractionator, Chem. Eng. J. 93 (2003) 241–252. https://doi.org/10.1016/S1385-8947(03)00043-3.
- D. Kopiec, R. Rydlichowski, J. Zembrzuska, I. Budnik, Z. Lukaszewski, Removal of non-ionic surfactants in an activated sludge sewage treatment plant, Tenside, Surfactants, Deterg. 51 (2014) 445–450. https://doi.org/10.3139/113.110328.
- Hydraloop, Hydraloop, (2023). www.hydraloop.com (accessed March 27, 2023).
- M. Pehl, A. Arvesen, F. Humpenöder, A. Popp, E.G. Hertwich, G. Luderer, Understanding future emissions from low-carbon power systems by integration of life-cycle assessment and integrated energy modelling, Nat. Energy. 2 (2017) 939–945. https://doi.org/10.1038/s41560-017-0032-9.
- D. Gerrity, B. Pecson, R. Shane Trussell, R. Rhodes Trussell, Potable reuse treatment trains throughout the world, J. Water Supply Res. Technol. – AQUA. 62 (2013) 321–338. https://doi.org/10.2166/aqua.2013.041.
- V. Fantin, S. Scalbi, G. Ottaviano, P. Masoni, A method for improving reliability and relevance of LCA reviews: The case of life-cycle greenhouse gas emissions of tap and bottled water, Sci. Total Environ. 476–477 (2014) 228–241. https://doi.org/10.1016/j.scitotenv.2013.12.115.
- C. Morandi, H. Steinmetz, How does greywater separation impact the operation of conventional wastewater treatment plants?, Water Sci. Technol. 79 (2019) 1605–1615. https://doi.org/10.2166/wst.2019.165.
- N. Meron, V. Blass, Y. Garb, Y. Kahane, G. Thoma, Why going beyond standard LCI databases is important: lessons from a meta-analysis of potable water supply system LCAs, Int. J. Life Cycle Assess. 21 (2016) 1134–1147. https://doi.org/10.1007/s11367-016-1096-7.
- F. Hendriks, J.G. Vogtländer, G.M.T. Janssen, The eco-costs/value ratio: A tool to determine the long-term strategy for delinking economy and environmental ecology, Int. J. Ecodynamics. 1 (2006) 136–148. https://doi.org/10.2495/ECO-V1-N2-136-148.
- J. Vogtländer, D. Peck, D. Kurowicka, The eco-costs of material scarcity, a resource indicator for LCA, derived from a statistical analysis on excessive price peaks, Sustain. 11 (2019). https://doi.org/10.3390/su11082446.
- G. Rebitzer, T. Ekvall, R. Frischknecht, D. Hunkeler, G. Norris, T. Rydberg, W.P. Schmidt, S. Suh,
- B.P. Weidema, D.W. Pennington, Life cycle assessment Part 1: Framework, goal and scope definition, inventory analysis, and applications, Environ. Int. 30 (2004) 701–720. https://doi.org/10.1016/j.envint.2003.11.005.
- NSF/ANSI, NSF/ANSI 350 Onsite Residential and Commercial Water Reuse Treatment Systems, (2022) 60.
- Ecocosts Value, Appendix A Fast-track LCA Calculation, Ecocosts Value. (n.d.) 18. https://ecocostsvalue.com/EVR/img/references ecocosts/Appendix A 3.pdf.
- Sustainability Impact Metrics, Idemat2023, (2023). https://www.ecocostsvalue.com/data-tools- books/.
- J. Vogtländer, LCA, a practical guide for students, designers and business managers, 2012. https://www.researchgate.net/publication/258220969.
- C. Copeland, N.T. Carter, Energy – Water Nexus : The Water Sector ’ s Energy Use, Congr. Res. Srvice. (2017).
- NYC Environmental Protection, New York City drinking water supply and quality report-2020, (2020) 20. https://www1.nyc.gov/assets/dep/downloads/pdf/water/drinking-water/drinking- water-supply-quality-report/2020-drinking-water-supply-quality-report.pdf.
- Muñoz, Towards global LCI data on urban wastewater discharges WW LCI v3, in: SETAC Eur. 29th Annu. Meet., Helsinki, 2019.
- G. Klein, M. Krebs, California ’ s Water – Energy Relationship F INAL S TAFF R EPORT, (2005).
- G. Thomassen, S. Huysveld, L. Boone, C. Vilain, D. Geysen, K. Huysman, B. Cools, J. Dewulf, The environmental impact of household’s water use: A case study in Flanders assessing various water sources, production methods and consumption patterns, Sci. Total Environ. 770 (2021) 145398. https://doi.org/10.1016/j.scitotenv.2021.145398.
- B. Hofs, W. van den Broek, A. van Eckeveld, A. van der Wal, Carbon footprint of drinking water over treatment plant life span (2025–2075) is probably dominated by construction phase, Clean. Environ. Syst. 5 (2022) 100079. https://doi.org/10.1016/j.cesys.2022.100079.
- Stowa, WaterKIP WaterKeten Integratie Projecten Op weg naar een klimaatneutrale waterketen, (2008).
- G.J. Pronk, S.F. Stofberg, T.C.G.W. Van Dooren, M.M.L. Dingemans, J. Frijns, N.E. Koeman-Stein, P.W.M.H. Smeets, R.P. Bartholomeus, Increasing Water System Robustness in the Netherlands: Potential of Cross-Sectoral Water Reuse, Water Resour. Manag. 35 (2021) 3721–3735. https://doi.org/10.1007/s11269-021-02912-5.
- M. El Azhari, D. Loudyi, Analysis of the water–energy nexus in central Oum Er-Rbia sub-basin– Morocco, Int. J. River Basin Manag. 17 (2019) 13–24. https://doi.org/10.1080/15715124.2018.1446966.
- Habib, B. Bouchaib, S. Housni, A critical analysis of water economics in public water and sanitation services in Morocco, Arab Gulf J. Sci. Res. 40 (2022) 280–301. https://doi.org/10.1108/AGJSR-04-2022-0034.
- H. Al-Mutrafi, W. Al-Zubari, A. El-Sadek, I.A. Gelil, Assessment of the Water-Energy Nexus in the Municipal Water Sector in Eastern Province, Saudi Arabia, Comput. Water, Energy, Environ. Eng. 07 (2018) 1–26. https://doi.org/10.4236/cweee.2018.71001.
- A.A. Quraishi, K.H. Al-Dhowalia, Losses in Riyadh Water Distribution Network, J. King Saud Univ. – Eng. Sci. 6 (1994) 17–25. https://doi.org/10.1016/S1018-3639(18)30596-8.
- World Resources Institute, Aqueduct Water Risk Atlas, World Resour. Inst. (2023). https://www.wri.org/aqueduct.
- D. Yang, J. Liu, J. Yang, N. Ding, Life-cycle assessment of China’s multi-crystalline silicon photovoltaic modules considering international trade, J. Clean. Prod. 94 (2015) 35–45. https://doi.org/10.1016/j.jclepro.2015.02.003.
- SolarGIS, Global Solar Atlas, (2020). https://solargis.com/maps-and-gis-data/download.
- CBS, Nederland in cijfers, Cent. Bur. Voor Stat. 1 (2022) 16.
- O. Wolf, R. Kaps, Development of European Ecolabel and Green Public Procurement Criteria for Sanitary Tapware – Taps and Showerheads – TAPS AND SHOWERHEADS Development of European Ecolabel and Green Public Procurement Criteria for Sanitary Tapware – Taps and Showerheads Ba, (2011) 41.
- Centraal Bureau voor de Statistiek, Average household size in the Netherlands from 2009 to 2023, Stat. Res. Dep. (2023). https://www-statista- com.ezproxy.library.wur.nl/statistics/521792/netherlands-average-household-size/#:~:text=The average household size in,in the Netherlands since 1950.
- Vereniging van Waterbedrijven in Nederland, Total household drinking water usage per person per day in the Netherlands from 1995 to 2016 (in liters) [Graph], Statista. (2017). https://www.statista.com/statistics/593385/household-drinking-water-use-in-the-netherlands/ (accessed February 15, 2024).
- Ministry of Environment Water and Agriculture (Saudi Arabia), Average daily per capita consumption of water in Saudi Arabia in 2021, by region(in liters per person per day), Statista. (2022). https://www.statista.com/statistics/1378159/saudi-arabia-urban-water-consumption-by- source/ (accessed February 15, 2024).
- Kiefer, Krentz, Average per capita household water use in the United States, Statista. (2018). https://www.statista.com/statistics/886597/us-city-per-capita-water-consumption-households/ (accessed February 15, 2024).